Monte Carlo Football Predictions & Upset Watch
Updated for Week 13 of the 2024 NFL Season

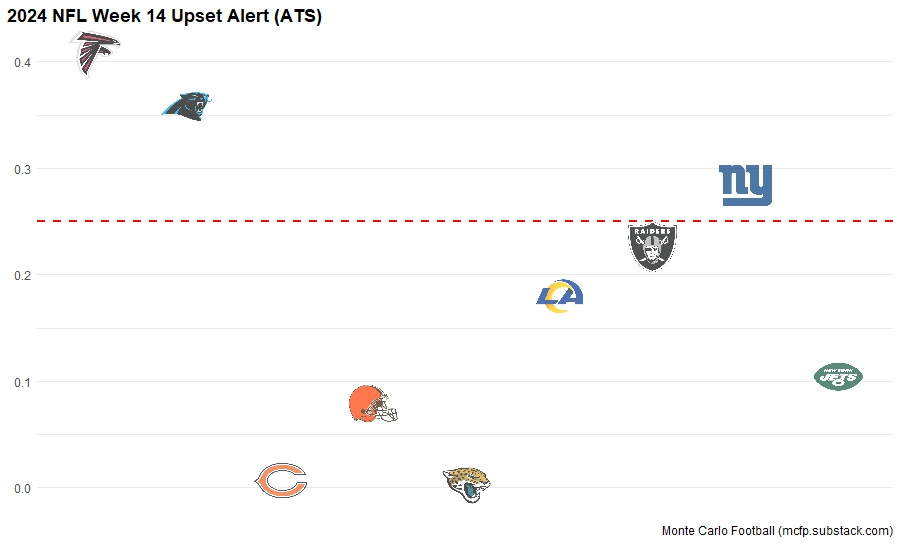
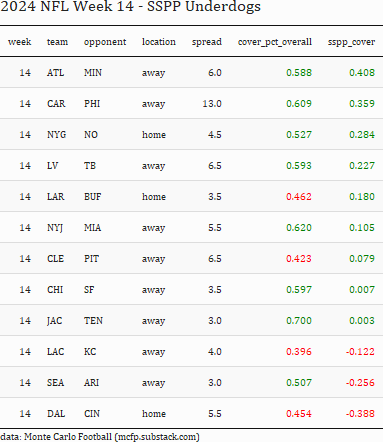
Upset Watch
An SSPP metric above 0.25 is considered to be a good bet on the underdog. The metric measures the difference in expected win percentages of the Monte Carlo Simulations and a set of four optimization ratings based on a combination of game results for the entire season and for the most recent games, with a bias granted to teams who won their previous game.

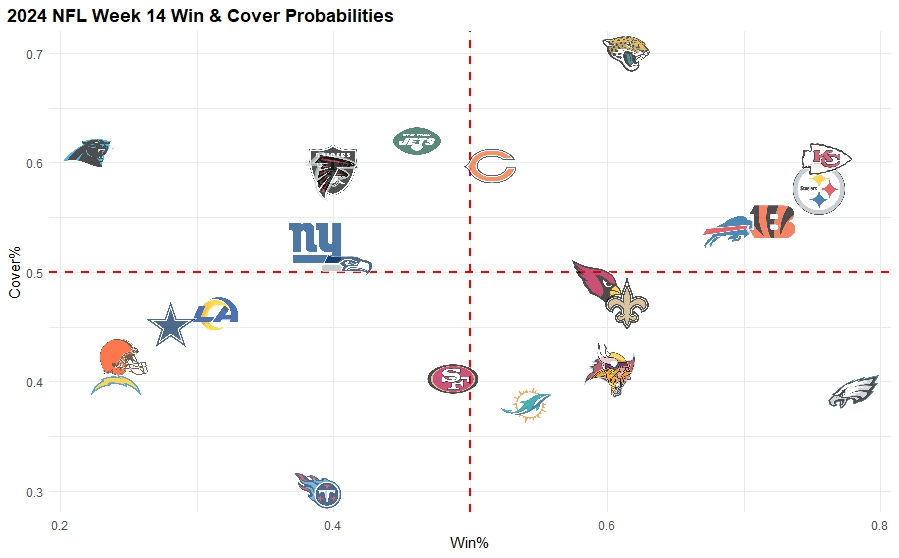
Picks & Ratings
Win and cover probabilities by game and team, along with Expected Values. Additionally, you can see how the Monte Carlo Simulation components rate each team with standardized scores for quality of starting QB, Injuries, results of historical games with similar lines and totals, and consensus computer picks.

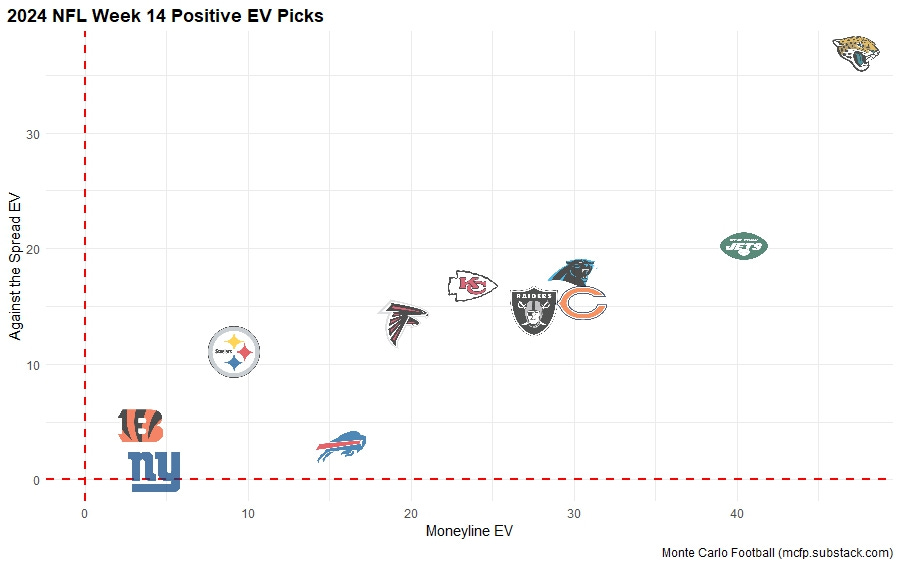
Positive EV Picks
Games with the highest expected value.